



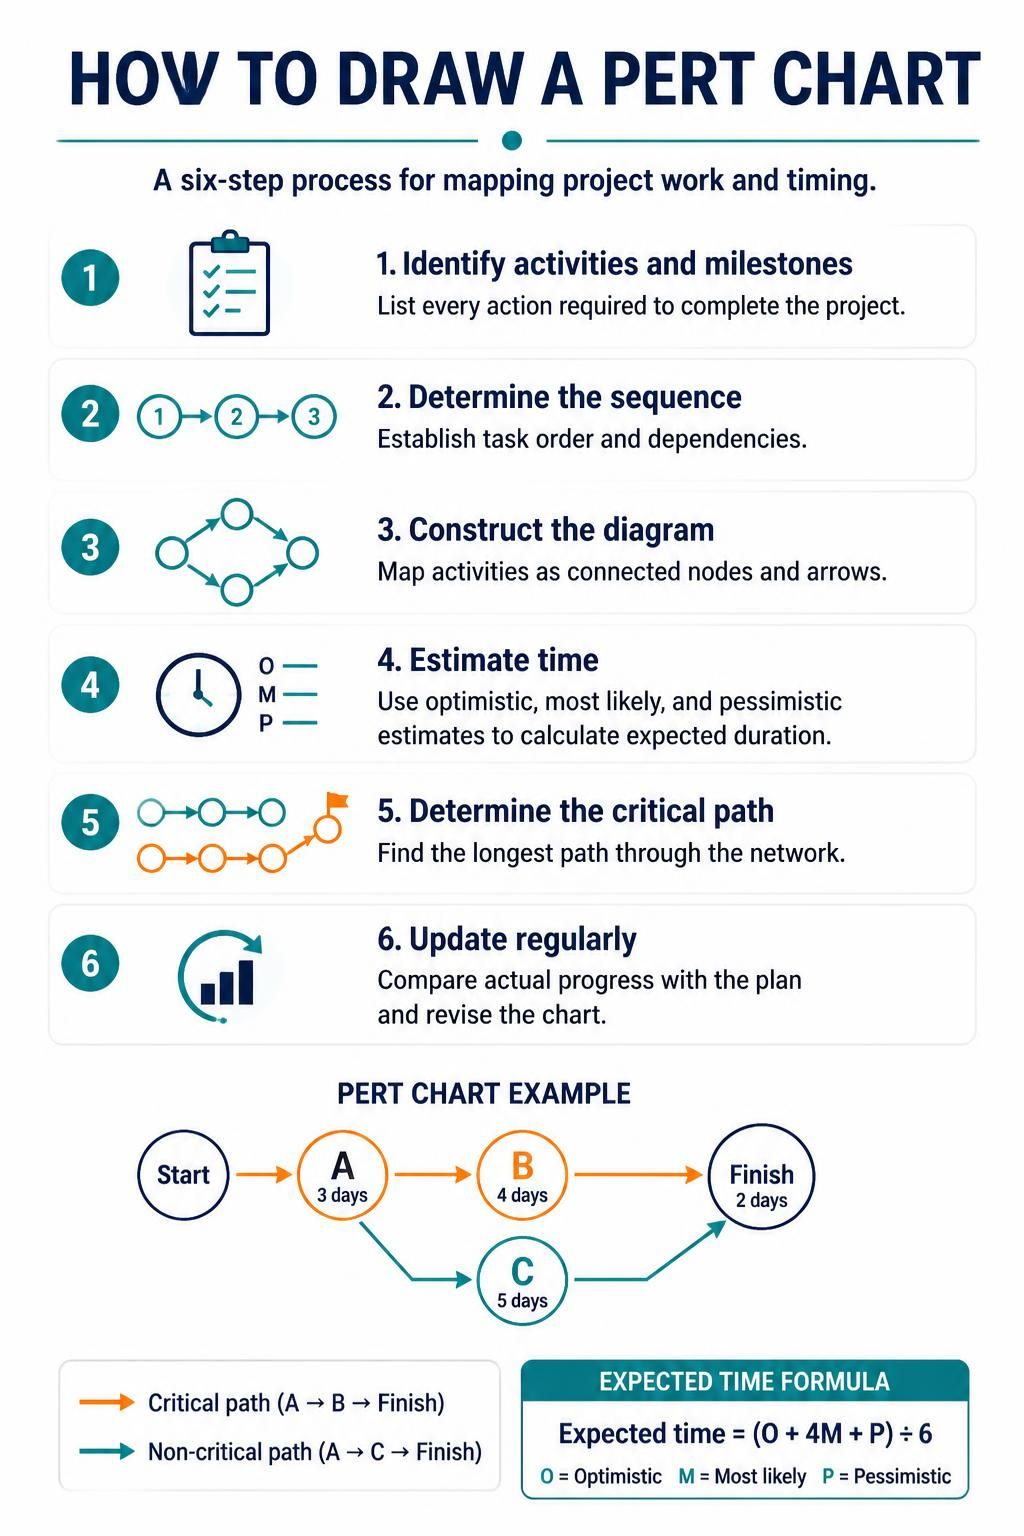
In the realm of project management, uncertainty is the only certainty. Whether you are developing complex software, constructing a skyscraper, or launching a new product, the ability to visualize dependencies and calculate realistic timelines is paramount. The Program Evaluation and Review Technique (PERT) chart stands as a robust analytical tool designed to handle this complexity. Unlike standard Gantt charts, which focus heavily on scheduling, a PERT chart focuses on the relationships between tasks and the mathematical probability of meeting deadlines.
This tutorial breaks down the system architecture of a PERT chart, the mathematical logic behind its creation, and the step-by-step process to model your project effectively using modern tools.
Understanding the Core Architecture
At a high level, a PERT chart is a directed graph (a network diagram). It consists of two primary architectural components:
- Nodes (Events): These represent specific milestones or the start/end points of activities. In the diagram examples, these are often depicted as circles.
- Edges (Activities): These are the arrows connecting the nodes, representing the actual work or tasks that must be performed to move the project from one state to another.
The power of this architecture lies in its ability to map out the Critical Path. This is the longest sequence of dependent tasks from the start to the finish. Any delay in a task on this path directly delays the entire project. Conversely, tasks not on the critical path possess “slack” or “float,” meaning they can be delayed to a certain extent without impacting the final delivery date.
The Mathematical Engine: Expected Time Calculation
One of the most distinct features of PERT charting is its probabilistic approach to time estimation. In many projects, a single number for a task’s duration is a guess. PERT demands a weighted average derived from three data points to calculate a more scientifically accurate “Expected Time” ($t_e$).
The formula used is:
Expected Time (t_e) = (Optimistic + 4 × Most Likely + Pessimistic) ÷ 6Where:
- Optimistic (O): The shortest possible time to complete the task if everything goes perfectly.
- Most Likely (M): The realistic time required under normal conditions.
- Pessimistic (P): The longest time required if significant risks or delays occur.
This formula gives four times the weight to the “Most Likely” scenario, smoothing out the outliers and providing a balanced view of the project timeline.
Step-by-Step: Constructing the Chart
Creating a PERT chart is a systematic exercise in logic and planning. Here is the workflow you should follow to build a robust model.
1. Identify Activities and Milestones
The foundation of your chart is the Work Breakdown Structure (WBS). List every specific action required to complete the project. These are the activities. You must also identify milestones—major events that signify the completion of a phase (e.g., “Design Approved” or “Beta Launch”).
2. Determine the Sequence and Dependencies
This is the most critical logic step. You must ask: Which tasks depend on others? You need to establish the proper order. For example, you cannot “Paint the Wall” (Activity B) before you “Frame the Wall” (Activity A). This establishes the flow of the arrows in your diagram.
3. Construct the Diagram
Map out your nodes and arrows. Start with the beginning node and draw arrows representing the flow of work. If two tasks can happen at the same time, they will branch out from the same node. If two tasks must finish before a third can start, they will converge on a single node.
4. Estimate Time
Now, apply the numbers. Assign durations to each activity. As mentioned earlier, for a true PERT analysis, use the O-M-P method to calculate the expected duration for every single arrow in your chart.
5. Determine the Critical Path
Calculate the longest path through the network. To do this manually, you sum the expected times of all activities along every possible path from Start to Finish. The path with the highest total time is your Critical Path. This path dictates the minimum time required to complete the project.
6. Update Regularly
A PERT chart is a living document. As the project progresses, update the chart to reflect actual progress versus planned progress. If a task on the critical path is delayed, you must re-calculate the critical path, as a non-critical path might suddenly become critical.
Practical Example: A Simple Project Model
Let’s visualize a small project to see how these concepts interact. Imagine a project with three main activities: A, B, and C.
- Activity A: Design Phase (3 days)
- Activity B: Development Phase (4 days)
- Activity C: Testing Phase (5 days)
In this scenario, the flow might look like this:
- Start leads to Activity A.
- After Activity A, the project splits:
- Path 1: Activity A → Activity B → Finish
- Path 2: Activity A → Activity C → Finish
By calculating the total duration of each path, you can identify which sequence of tasks is the bottleneck. In many real-world scenarios, tools like Visual Paradigm can automate this calculation, allowing you to draw the diagram and instantly see the critical path highlighted in a different color.
Why Use PERT? The Strategic Advantages
While drawing diagrams might seem tedious, the insights gained are invaluable for specific challenges:
- Realistic Timetabling: It moves you away from guess-based scheduling to data-driven schedules.
- Parallel Processing: It helps you identify tasks that can be executed concurrently to save time.
- Resource Compression: It determines which tasks can be shortened (crashed) if the overall deadline needs to be moved up.
- Slack Time Analysis: It identifies tasks with “float,” allowing flexibility in resource allocation.
By mastering the PERT chart, you are not just drawing arrows; you are building a mathematical model of your project’s success.