



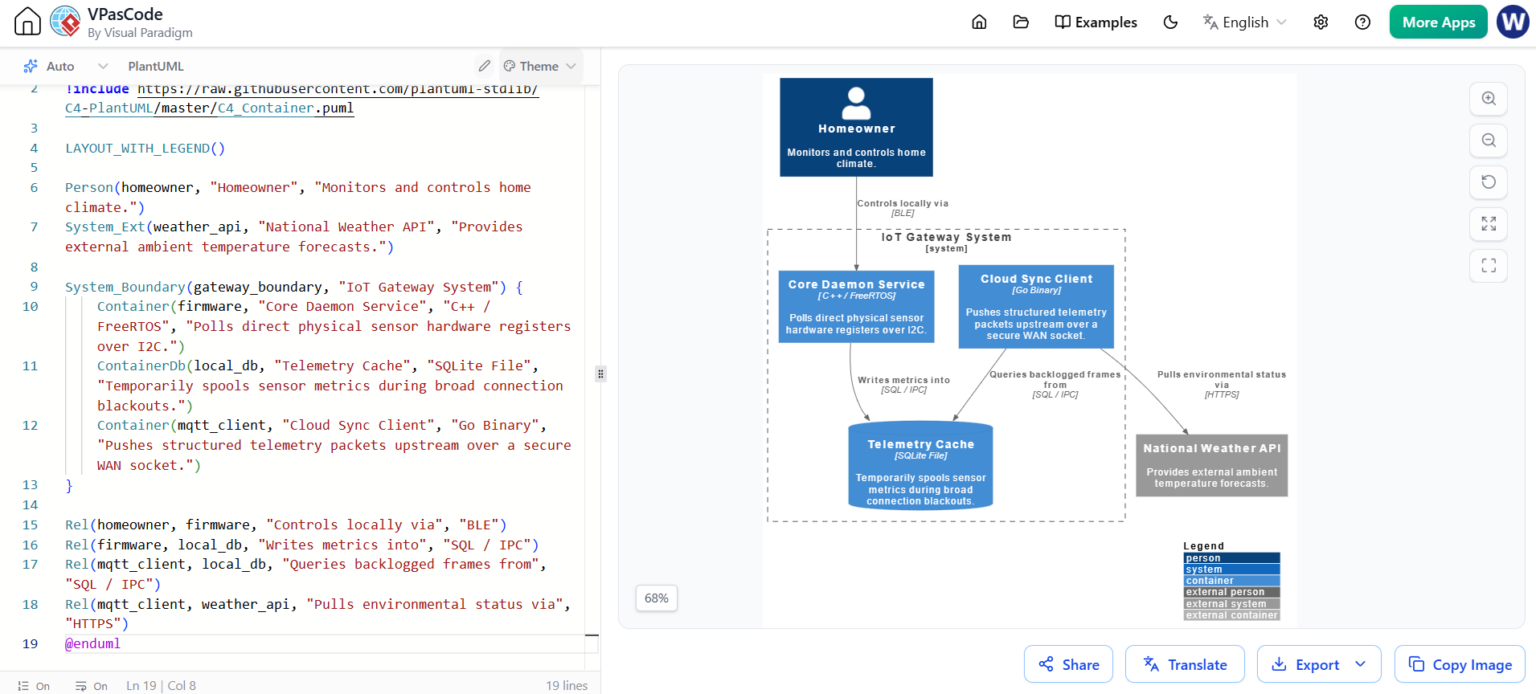
In modern software architecture, understanding the interaction between physical hardware and cloud services is critical. This tutorial explores a specific architectural visualization: the Level 2 Container Diagram for an IoT Gateway System. Using the C4 model methodology within a VPasCode environment, we break down how to represent complex embedded systems, local databases, and external data streams in a single, cohesive view.
Unlike a high-level context diagram that shows a system as a black box, a Level 2 diagram “opens the box.” It reveals the internal runtime environments, process boundaries, and the specific technologies (languages, databases) powering the application. Below, we walk through the construction of this diagram, the specific modeling choices made, and the technical logic behind the relationships.
The C4 Model: Why Use Containers?
The C4 model is a hierarchical approach to software architecture documentation. It consists of four levels:
- Level 1 (Context): Shows the system and its users.
- Level 2 (Container): Shows the high-level technical building blocks (containers) that make up the system.
- Level 3 (Component): Shows the internal structure of a container.
- Level 4 (Code): Shows the actual code classes and dependencies.
This tutorial focuses on Level 2. In the provided example, we are modeling an IoT Gateway System. This is a critical boundary because it represents the edge of the network where physical sensors meet the cloud.
Step-by-Step: Constructing the Diagram
To recreate this architecture, we use PlantUML code. This code is parsed by the VPasCode editor to render the visual diagram on the right.
1. Setting the Stage: Includes and Layout
First, we need to load the C4 PlantUML library. This library provides the standard shapes (people, containers, boxes) and styling rules.
!include https://raw.githubusercontent.com/plantuml-stdlib/C4-PlantUML/master/C4_Container.puml

LAYOUT_WITH_LEGEND()
The LAYOUTWITHLEGEND() command is a specific directive that tells the renderer to automatically organize the elements and generate a key explaining what the shapes mean (e.g., “Person” vs “Container”).
2. Defining the Actors and External Systems
Before defining what is inside the gateway, we must define who interacts with it and what it talks to outside.
Person(homeowner, "Homeowner", "Monitors and controls home climate.")
System_Ext(weather_api, "National Weather API", "Provides external ambient temperature forecasts.")- Person(homeowner…): Represents the human user. The label describes their role.
- SystemExt(weatherapi…): Represents a system outside our boundary. We use
SystemExtrather than a standardSystemto indicate that the source code is not under our control (it’s a third-party API).
3. The System Boundary and Containers
This is the core of the diagram. We define a SystemBoundary to group everything that happens inside the IoT Gateway hardware.
System_Boundary(gateway_boundary, "IoT Gateway System") {
    Container(firmware, "Core Daemon Service", "C++ / FreeRTOS", "Polls direct physical sensor hardware registers over I2C.")
    ContainerDb(local_db, "Telemetry Cache", "SQLite File", "Temporarily spools sensor metrics during broad connection blackouts.")
    Container(mqtt_client, "Cloud Sync Client", "Go Binary", "Pushes structured telemetry packets upstream over a secure WAN socket.")
}
Notice the specific types of containers used:
- Container(firmware…): This represents the firmware running on the microcontroller. The description highlights the low-level interaction: polling hardware registers over
I2C. - ContainerDb(localdb…): We use
ContainerDbspecifically for databases. The description explains the “store-and-forward” pattern: buffering data when the internet is down. - Container(mqttclient…): This represents a client process (likely running as a separate thread or sidecar process) responsible for cloud connectivity.
4. Defining Relationships (The “Lines”)
Finally, we draw the arrows. In PlantUML, the Rel command stands for “Relationship.” The syntax is generally Rel(Source, Target, "Label", "Protocol").
Rel(homeowner, firmware, "Controls locally via", "BLE")
Rel(firmware, local_db, "Writes metrics into", "SQL / IPC")
Rel(mqtt_client, local_db, "Queries backlogged frames from", "SQL / IPC")
Rel(mqtt_client, weather_api, "Pulls environmental status via", "HTTPS")
Key architectural insights from these relationships:
- BLE (Bluetooth Low Energy): The homeowner interacts directly with the firmware via Bluetooth, not via the cloud.
- IPC (Inter-Process Communication): Notice that the firmware and the MQTT client interact with the database via
SQL / IPC. This implies that the database is a local file (SQLite) that acts as a bridge between the C++ firmware process and the Go client process. - HTTPS: The cloud client talks to the Weather API over the public internet.
Technical Analysis: The Store-and-Forward Pattern
This diagram illustrates a classic pattern in IoT engineering: Store-and-Forward. In the diagram, the Telemetry Cache (SQLite) is the critical component. It decouples the data collection (firmware) from data transmission (MQTT Client).
Without this container, if the internet went down, the sensor data would be lost. By introducing the ContainerDb, the system ensures data integrity. The diagram clearly communicates that the “Cloud Sync Client” must have logic to query the database for “backlogged frames” before sending new data.
Conclusion
By utilizing VPasCode and the C4 PlantUML library, we have transformed a complex hardware-software architecture into a clear, readable diagram. The Level 2 view effectively communicates not just who uses the system, but how it works internally—highlighting the separation of concerns between sensor polling, local data storage, and cloud synchronization.