



Flowcharts are the backbone of visual programming and business process analysis. They transform complex, abstract logic into a structured, readable narrative. However, the power of a flowchart lies not just in drawing lines, but in selecting the correct standardized symbols to represent specific actions. In the context of modern tools like Visual Paradigm and its VPasCode AI tool, understanding these symbols is the first step toward converting natural language requirements into executable system architectures.
This tutorial will walk you through the essential symbolism of flowcharts, breaking down each shape’s technical meaning and how it translates into your modeling workflow.
The Anatomy of a Flowchart: From Concept to Shape
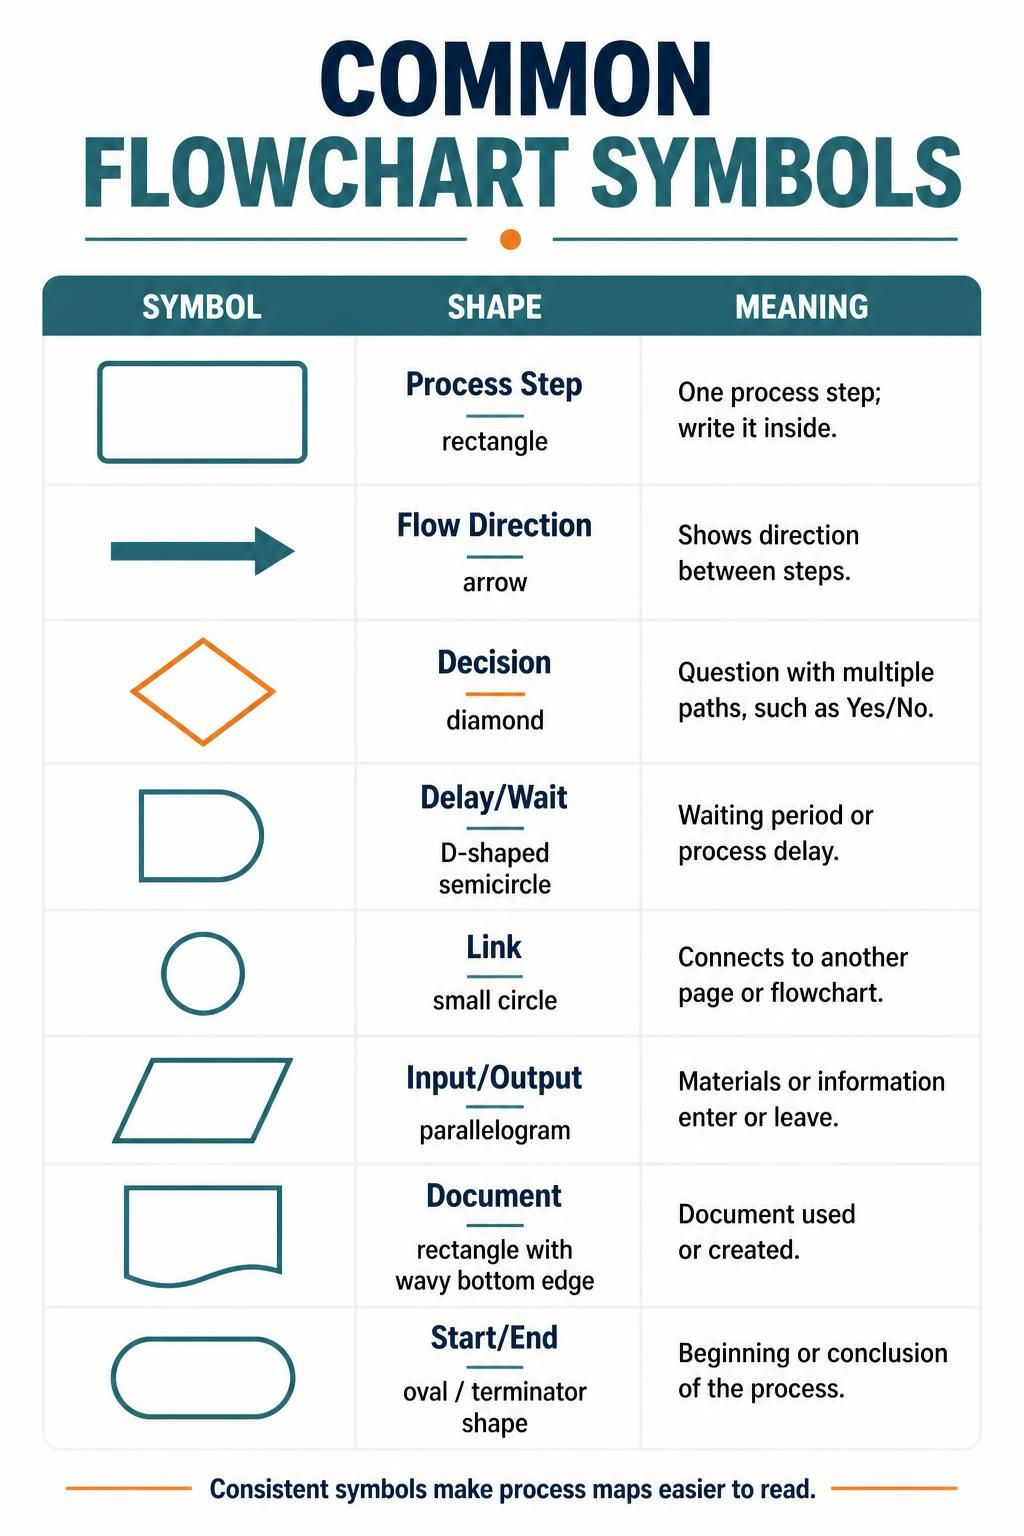
A well-constructed flowchart relies on a strict grammar of shapes. Deviating from these standards can lead to ambiguity in the process logic. Let’s deconstruct the symbols presented in our reference guide.
1. Process Steps and Flow Direction
The workhorse of any flowchart is the Rectangle. It represents a specific Process Step—an action, operation, or function that transforms data or moves a process forward. When writing code or defining logic, this is where the “meat” of the operation resides.
- Shape: Rectangle
- Meaning: “Do something.” For example, “Calculate Total,” “Validate User,” or “Print Report.”
- Flow Direction: Represented by Arrows. These are not merely decorative; they dictate the sequence. The arrow defines the path of execution from one step to the next.
2. Decision Points and Logic Branching
Real-world processes are rarely linear; they depend on conditions. This is where the Diamond comes into play.
- Shape: Diamond
- Meaning: Decision. This shape asks a question with multiple outgoing paths, typically “Yes/No” or “True/False.”
- Technical Context: In VPasCode or logic modeling, this represents an
if-elsestatement. The path taken depends entirely on the outcome of the decision node.
3. Input/Output and Documentation
Processes do not exist in a vacuum; they interact with the outside world. We use specific shapes to denote data entry and external references.
- Input/Output (Parallelogram): This shape signifies that materials or information are entering the system or leaving it. It represents user input, database retrieval, or a final report generation.
- Document (Wavy Bottom Rectangle): This specific shape denotes a physical or digital document used or generated by the process. Unlike a simple process step, this emphasizes the creation or consumption of a record.
4. Delays and Connections
Not every moment in a process is active work. Sometimes, the system waits.
- Delay/Wait (D-Shaped Semicircle): This indicates a waiting period. In system architecture, this might represent a scheduled task, a timeout, or a batch process that pauses execution.
- Link (Circle): Flowcharts can become unwieldy. The Link symbol acts as a connector, allowing you to jump to another page or a different section of a large diagram without drawing a long, crossing line.
Terminators: Defining the Boundaries
Every story has a beginning and an end, and every algorithm must terminate. The Start/End symbol (often a rounded rectangle or oval) serves as the Terminator.
It marks the entry point where the process initiates and the exit point where the process concludes. Without these boundaries, a flowchart is just an infinite loop of undefined logic.
Implementing Symbols with VPasCode
When using VPasCode (Visual Paradigm’s AI-driven coding tool), you don’t just draw these shapes; you define the logic that drives them. For example, when you define a “Decision” node, VPasCode can automatically generate the conditional logic required to render the diamond shape in your code or diagram.
%% Example: Flowchart Logic Structure
graph TD
    Start([Start Process]) --> Input[Input Data]
    Input --> Decision{Is Valid?}
    Decision -- Yes --> Process[Process Data]
    Decision -- No --> Error[Display Error]
    Process --> Output[Generate Output]
    Error --> End([End Process])
    Output --> End
In the code above, you can see the direct translation of our symbols into a Mermaid graph structure. The Start and End are rounded rectangles, the Decision is a diamond, and the Process steps are standard rectangles.
Conclusion
Standardized symbols ensure that your flowcharts are universally understood, whether you are a developer, a business analyst, or a stakeholder. By mastering the nuances of the Rectangle, Diamond, Parallelogram, and others, you lay the groundwork for robust system architecture. When paired with tools like Visual Paradigm, these symbols become the blueprint for efficient, AI-assisted software development.