



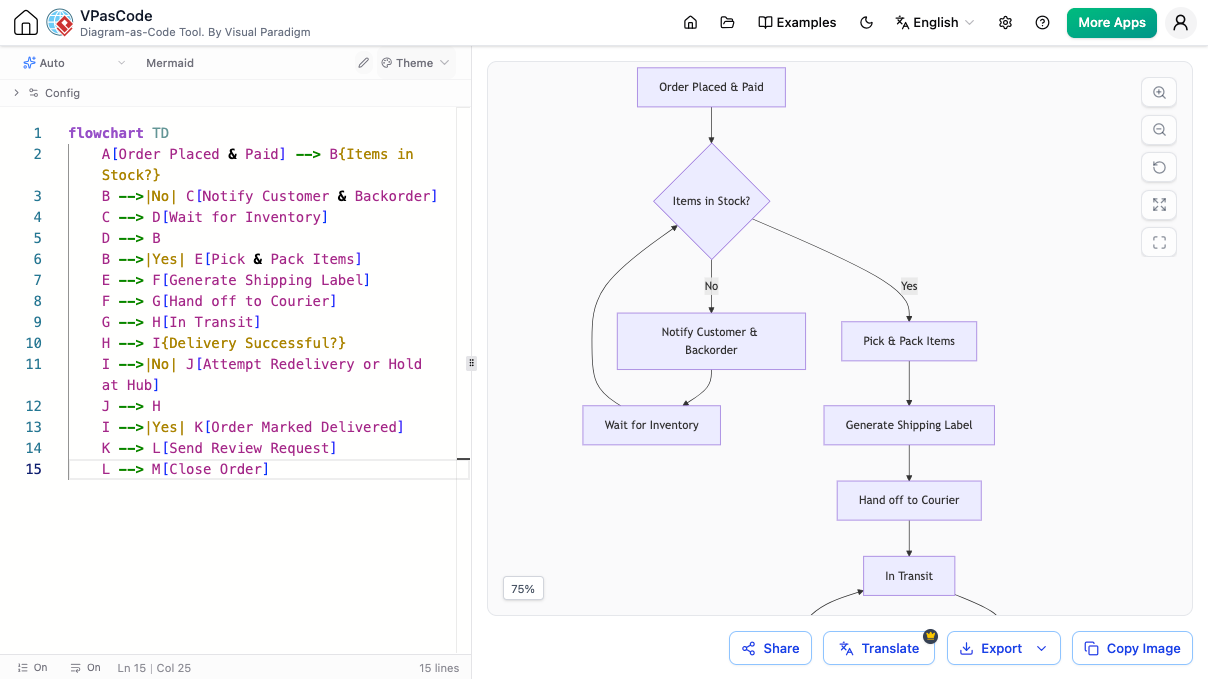
Welcome to this comprehensive tutorial on creating complex business process diagrams using VPasCode, Visual Paradigm’s diagram-as-code tool. In this guide, we will dissect a real-world scenario: the Online Order Fulfillment Process. By utilizing Mermaid syntax, we can programmatically define the flow of data and decisions, ensuring that your documentation is as precise as your software architecture.
Whether you are a Product Manager mapping user journeys or a Developer designing system logic, understanding how to translate a flowchart into code is a vital skill. Let’s dive into the architecture and logic of this specific workflow.
Understanding the Workflow Architecture
The diagram presented in VPasCode visualizes a “Top-Down” (TD) flowchart. This specific orientation is chosen because it naturally mimics the chronological progression of an event: from the initial trigger (the order) down to the final resolution (closing the order). The process is governed by a central decision point: Stock Availability.
At a high level, the system splits into two distinct paths:
- The “Yes” Path (Happy Path): Items are in stock, allowing the process to move immediately to fulfillment.
- The “No” Path (Exception Handling): Items are out of stock, triggering a notification and a wait state before the order can be fulfilled.
Step-by-Step Logic Analysis
Let’s break down the Mermaid code line by line to understand how the logic flows.
1. The Entry Point
The process initiates with A, representing the trigger event. In code, this is defined as:
A[Order Placed & Paid] --> B{Items in Stock?}Here, node B is a decision diamond. It acts as a gatekeeper, forcing the flow to evaluate the inventory status before proceeding.
2. Handling Out-of-Stock Scenarios (The “No” Branch)
If the decision at node B is “No”, the flow moves to node C. This step involves critical customer communication and internal logistics:
B -->|No| C[Notify Customer & Backorder]This is followed by a wait state:
C --> D[Wait for Inventory]Crucially, once inventory is replenished (represented by node D), the flow must loop back to the decision point to re-evaluate the order. This is achieved via the connection D --> B. This creates a “wait-for-loop” pattern, ensuring the order isn’t prematurely closed while waiting for goods.
3. The Fulfillment Sequence (The “Yes” Branch)
If the decision at node B is “Yes”, the order moves to the fulfillment phase:
B -->|Yes| E[Pick & Pack Items]This initiates a linear chain of events representing the physical movement of goods:
- Pick & Pack (E): Warehouse staff locates and packages the item.
- Generate Label (F): Shipping documentation is created.
- Hand off to Courier (G): The item leaves the facility.
- In Transit (H): The item is currently being transported.
4. Post-Delivery Logic (The Feedback Loop)
The flowchart cleverly handles the post-delivery phase using a feedback loop. Once the item is “In Transit,” it reaches a final decision node I regarding the delivery status:
H --> I{Delivery Successful?}If the delivery fails (I -->|No|), the system enters a remediation phase: J (Attempt Redelivery or Hold at Hub). Once resolved, the flow loops back to H to retry the transit status.
5. Conclusion and Cleanup
Finally, if the delivery is successful, the order is marked as delivered and the process concludes:
I -->|Yes| K[Order Marked Delivered]
K --> L[Send Review Request]
L --> M[Close Order]
Technical Implementation in VPasCode
VPasCode allows you to render this logic instantly. By using the flowchart TD declaration, we define the direction. The syntax [Text] creates a rectangle (process), while {Text?} creates a diamond (decision). The arrows --> connect these nodes.
Why Use Diagram-as-Code?
Using VPasCode for this architecture offers distinct advantages over traditional drag-and-drop tools:
- Version Control: Since the diagram is plain text, it can be stored in Git repositories alongside your code, allowing you to track changes to your business logic over time.
- Consistency: Coding ensures that font sizes, spacing, and alignment are handled automatically, keeping your documentation professional.
- Modularity: Complex logic like the "Wait for Inventory" loop is easy to visualize and modify without fighting the mouse to connect lines.
By mastering these patterns, you can build robust, scalable diagrams that serve as the single source of truth for your product and development teams.