



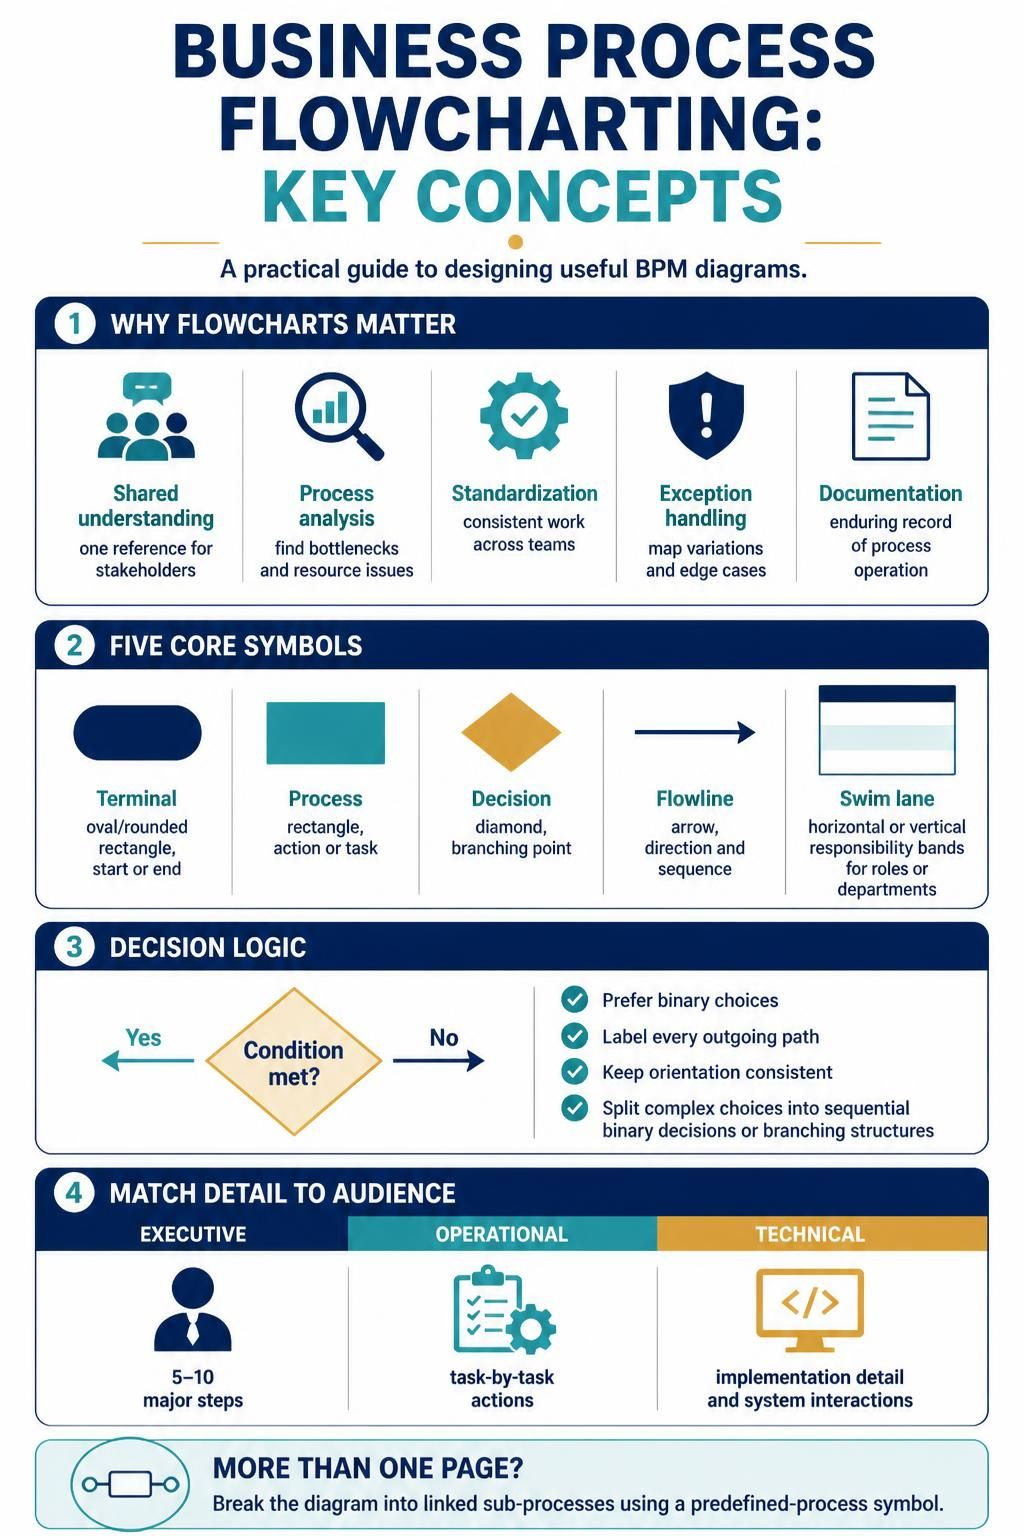
In the realm of Business Process Management (BPM), clarity is currency. The ability to visualize complex workflows is not just a design exercise; it is a fundamental analytical instrument. This tutorial explores the core principles of business process flowcharting, focusing on the symbolic language used to define logic, the strategic placement of responsibility, and how to tailor diagrams for specific audiences.
1. The Strategic Purpose of Flowcharts
Many organizations mistakenly treat flowcharts as mere decorative diagrams—static images inserted into reports. However, in a professional BPM context, a flowchart is a dynamic tool that serves five critical functions:
- Shared Understanding: It creates a “Rosetta Stone” for the organization, establishing a common reference point for stakeholders ranging from executives to IT developers.
- Process Analysis: It acts as a diagnostic tool, helping analysts identify bottlenecks, resource allocation issues, and inefficiencies that are invisible in raw data.
- Standardization: It ensures that work is executed consistently across different teams or departments, reducing variability and error.
- Exception Handling: A robust flowchart maps the “happy path” but crucially also identifies variations and edge cases that deviate from the normal flow.
- Documentation: It provides an enduring record of how processes should operate, serving as a baseline for training and future optimization.
2. The Five Core Symbols of BPM
While specialized software offers hundreds of shapes, effective flowcharts rely on a subset of five fundamental elements. Mastery of these symbols allows for precise communication of system logic.
Terminal: The Start and Stop
Represented by an Oval or Rounded Rectangle, this symbol marks the absolute beginning or the final conclusion of a process. It defines the boundaries of the scope being modeled.
Process: The Action
The Rectangle is the workhorse of flowcharting. It represents a specific action, task, or operation where data is transformed or a decision is executed. This is where the actual work happens.
Decision: The Logic Gate
The Diamond or Rhombus indicates a branching point. Unlike a process step, this shape does not perform work; it evaluates a condition (True/False, Yes/No) and routes the flow accordingly. This is where the intelligence of the process resides.
Flowline: The Sequence
The Arrow is the connective tissue of the diagram. It shows the direction and sequence of steps, ensuring that the reader follows the logical path from start to finish without ambiguity.
Swim Lane: The Responsibility
One of the most powerful concepts in BPM is the Swim Lane. These horizontal or vertical bands denote responsibility. By segregating process steps into lanes assigned to specific people, roles, or departments, you instantly visualize handoffs and accountability.
3. Mastering Decision Logic
One of the most common pitfalls in process modeling is “spaghetti logic”—complex, tangled decision paths that are impossible to follow. To avoid this, adhere to strict rules when constructing decision diamonds:
- Prefer Binary Choices: Whenever possible, keep decisions binary (Yes/No). If a decision has three outcomes (e.g., Low, Medium, High), consider splitting it into a sequence of two binary decisions.
- Label Every Path: Never leave a flowline originating from a diamond unlabelled. Every branch must be clearly identified (e.g., “Approved,” “Rejected,” “Error”).
- Consistent Orientation: Maintain a consistent orientation for your logic. For example, always direct the “Yes” path to the right or down, and the “No” path to the left or up. This reduces cognitive load for the reader.
- Split Complex Choices: If a condition involves multiple variables, do not try to cram them into one diamond. Break them into sequential binary decisions or branching structures.
4. Matching Detail to the Audience
A single flowchart rarely serves every audience within an organization. The level of detail must be adjusted based on who is viewing the diagram:
- For the Executive (High-Level): Focus on the “Big Picture.” An executive summary should contain only 5–10 major steps. Avoid granular details; instead, highlight the strategic milestones and key decision points.
- For the Operational Team (Medium-Level): These users require task-by-task actions. The diagram must be detailed enough to serve as a work instruction, defining exactly what happens at each step without skipping intermediate tasks.
- For the Technical Team (Low-Level): Developers and engineers need implementation details. This includes specific system interactions, API calls, database writes, and complex error handling logic that is irrelevant to the business user.
5. Managing Complexity: More Than One Page?
As processes grow, they inevitably outgrow a single page. Attempting to cram a complex system into a limited space leads to unreadable diagrams. The industry standard solution is to break the diagram into linked sub-processes.
Use a Predefined Process Symbol (often a rectangle with double vertical lines) to represent a collapsed sub-process. This symbol acts as a placeholder that links to a separate, more detailed diagram, allowing you to maintain a clean high-level view while keeping detailed logic accessible.