



In the rapidly evolving landscape of software architecture and systems design, the traditional method of drawing diagrams using a mouse—clicking, dragging, and manually aligning boxes—is often too slow for agile development cycles. This is where VPasCode revolutionizes the workflow. As Visual Paradigm’s browser-based Diagram-as-Code editor, it shifts the paradigm from visual manipulation to logical definition, allowing developers and architects to generate complex visualizations through concise text-based scripts.
This tutorial explores the underlying architecture of VPasCode, the modeling concepts that power it, and how to leverage its multi-format support to streamline your documentation process.
Understanding the Diagram-as-Code Philosophy
VPasCode operates on a fundamental principle: diagrams are code. Instead of treating a diagram as a static image file, it treats the diagram definition as a source file. This approach offers several distinct advantages over traditional GUI-based drawing tools:
- Version Control Friendly: Text files are lightweight and diff-friendly. You can track changes in your diagrams just like you track changes in your source code using Git.
- Consistency: Automated rendering ensures that styling and layout rules are applied uniformly, eliminating the “pixel drift” that often occurs when manually resizing objects.
- Speed: Writing a definition is often faster than manually positioning nodes and connectors, especially for complex systems.
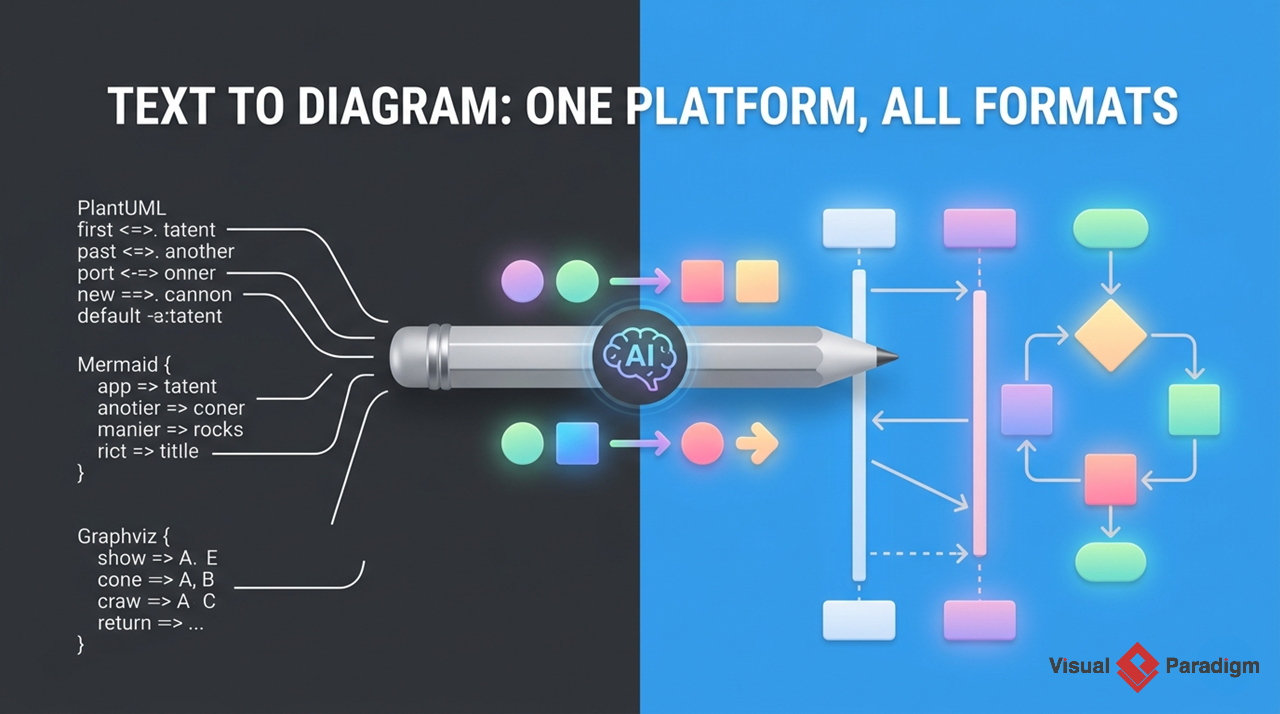
The core engine of VPasCode acts as a transpiler. It takes the raw text input on the left (the source) and processes it through an AI-enhanced rendering engine to produce the visual structure on the right (the target).
Supported Modeling Formats
One of VPasCode’s most powerful features is its ability to interpret multiple standard and proprietary diagramming languages within a single unified interface. This allows teams to utilize their preferred syntax while maintaining a centralized platform.
1. PlantUML
PlantUML is a widely adopted standard for creating UML diagrams, flowcharts, and sequence diagrams using a simple text language. VPasCode fully supports PlantUML syntax, allowing you to define class structures, component interactions, and state machines directly.
@startuml
skinparam componentStyle rectangle
actor User
participant "System" as Sys
User -> Sys: Request Data
activate Sys
Sys -> Sys: Process Request
return Data
deactivate Sys
@enduml
2. Mermaid
Mermaid is a JavaScript-based diagramming and charting tool that renders Markdown-inspired text definitions. It is particularly popular in documentation ecosystems like GitHub and GitLab. VPasCode supports Mermaid for flowcharts, gantt charts, and entity relationship diagrams.
flowchart TD
    A[Start] --> B{Is it working?}
    B -- Yes --> C[Great!]
    B -- No --> D[Fix it]
    D --> B
    C --> E[End]
3. D2 (Declarative Diagramming)
D2 is a modern, declarative diagramming language designed to be readable and writable. It uses indentation and simple syntax to define relationships between nodes, making it excellent for high-level system architecture.
server: {
  db: {
    type: postgres
  }
  web: {
    type: nginx
  }
}
server.db -> server.web
4. Graphviz
For users who prefer the classic DOT language, VPasCode supports Graphviz. This is ideal for generating directed graphs, network topologies, and dependency trees where layout algorithms can be strictly defined.
digraph G {
  A -> B;
  A -> C;
  B -> D;
  C -> D;
}
5. Data and Schema Visualization
Beyond standard UML and flowcharts, VPasCode extends into data modeling. It allows you to define schemas and visualize data relationships, making it a versatile tool for database architects and backend engineers.
System Architecture and Workflow
When you write code in VPasCode, the system follows a specific architecture to render the visual output:
- Parsing Layer: The editor parses the text input, identifying keywords, operators (like
<=>for bidirectional links), and node definitions. - Logic Engine: The engine interprets the relationships. For example, in PlantUML,
participant Acreates a node, andA -> Bcreates a directed edge. - Layout Engine: Unlike manual tools, VPasCode uses algorithms to automatically calculate node positions to minimize edge crossings and maximize readability.
- Rendering Layer: The final output is rendered as a vector graphic (SVG) or interactive canvas element, which can be exported or embedded.
Advanced Concepts: Ports and Connections
In complex system diagrams, simply connecting two boxes is often not enough. You need to specify where the connection attaches. VPasCode handles this through port definitions.
For instance, in PlantUML syntax, you can define specific ports on a component to ensure arrows connect to the correct side of a box (e.g., connecting to the top of a service and the bottom of a database). The syntax often looks like componentname <=> portname.
component "Frontend" as FE {
  component "API" as api
}
component "Backend" as BE {
  component "DB" as db
}
FE.api --> BE.api
By mastering these text-based definitions, you gain the ability to rapidly prototype system architectures, maintain diagrams alongside your codebase, and collaborate more effectively across development and operations teams.
Conclusion
VPasCode represents the future of technical documentation. By unifying multiple diagramming formats under a single, code-first platform, it empowers engineers to focus on the logic of their systems rather than the mechanics of drawing them. Whether you prefer the robustness of PlantUML, the simplicity of Mermaid, or the power of Graphviz, VPasCode provides the architecture to bring your ideas to life.