



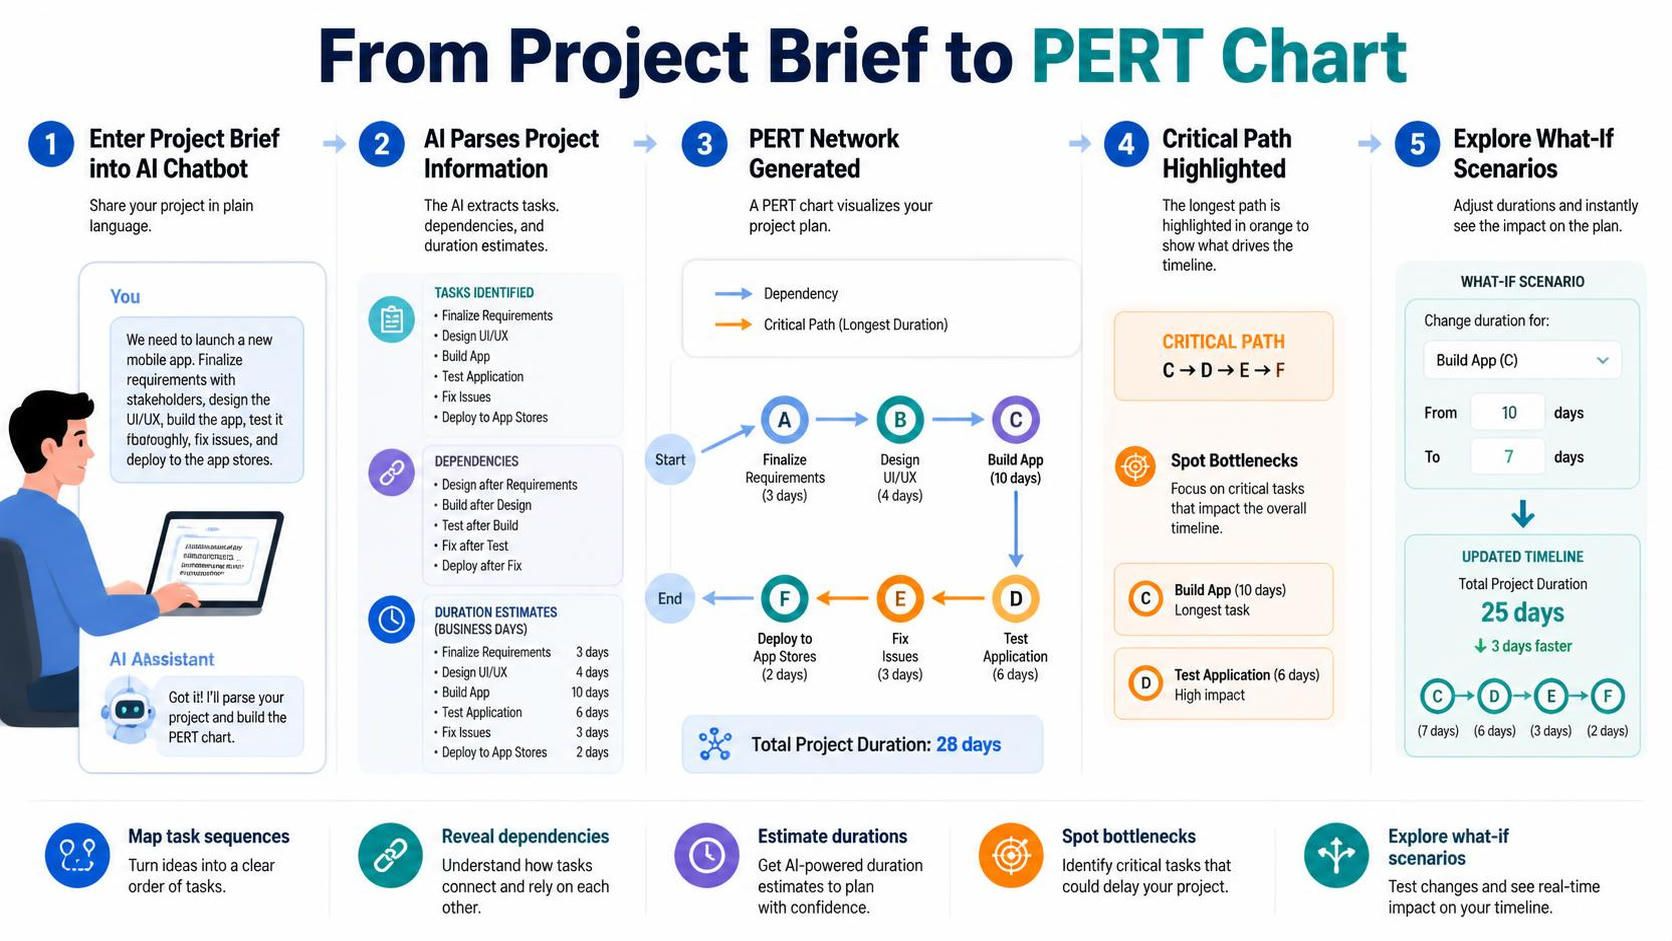
In the realm of project management, the gap between a raw idea and a structured execution plan is often bridged by complex scheduling tools. Traditionally, creating a Program Evaluation and Review Technique (PERT) chart required manual data entry into spreadsheets or drawing software, a process that was not only time-consuming but also prone to human error.
This tutorial explores a modern, AI-driven approach to project scheduling. Using the architecture demonstrated in the Visual Paradigm ecosystem, we will break down the five-step workflow that transforms a plain English project brief into a dynamic, interactive PERT chart. This method leverages Natural Language Processing (NLP) to automate the extraction of logic, dependencies, and durations, allowing project managers to focus on strategy rather than data entry.
Step 1: Inputting the Project Brief
The process begins with the most fundamental element of any project: the brief. In traditional workflows, this text sits in a document, disconnected from the schedule. In this AI-integrated model, the user inputs the project scope directly into an AI Chatbot interface.
The input can be unstructured text. For example, a project manager might type: “We need to launch a new mobile app. Finalize requirements, design the UI/UX, build the app, test it thoroughly, fix issues, and deploy to the app stores.”
The AI Assistant’s Role:
- The AI parses this natural language input.
- It identifies the intent: “Launch a mobile app.”
- It extracts the specific action verbs: Finalize, Design, Build, Test, Fix, Deploy.
Step 2: AI Parsing and Information Extraction
Once the text is received, the system performs a semantic analysis to convert the narrative into a structured data model. This is the “brain” of the operation, where the AI acts as a logical architect.
The parsing phase generates three distinct data points required for a PERT chart:
- Tasks Identified: The AI breaks the text down into discrete nodes.
- Finalize Requirements
- Design UI/UX
- Build App
- Test Application
- Fix Issues
- Deploy to App Stores
- Dependencies Mapped: The AI analyzes the logical flow to determine which tasks cannot start until others are finished.
- Design UI/UX depends on Finalize Requirements.
- Build App depends on Design UI/UX.
- Test Application depends on Build App.
- Fix Issues depends on Test Application.
- Deploy to App Stores depends on Fix Issues.
- Duration Estimates Calculated: Based on historical data or standard industry benchmarks for software development, the AI assigns estimated durations (in business days) to each task.
- Finalize Requirements: 3 days
- Design UI/UX: 4 days
- Build App: 10 days
- Test Application: 6 days
- Fix Issues: 3 days
- Deploy to App Stores: 2 days
Step 3: Generating the PERT Network
With the data extracted and structured, the system renders the visual representation: the PERT chart. This diagram visualizes the project timeline using nodes (circles representing tasks) and edges (arrows representing dependencies).
Visual Components:
- Nodes: Represent the specific tasks (A, B, C, etc.).
- Arrows: Represent the flow of time and dependency. An arrow from Task A to Task B means Task B cannot start until Task A is complete.
- Start/End Nodes: The chart includes a “Start” and “End” node to define the boundaries of the project.
The resulting network displays a linear sequence of events with the following estimated timeline:
Start -> A(3) -> B(4) -> C(10) -> D(6) -> E(3) -> F(2) -> End
Total Project Duration: 28 days
Step 4: Identifying the Critical Path
One of the most valuable features of a PERT chart is the Critical Path Method (CPM) analysis. The system highlights the longest path of dependent tasks through the network. This path determines the shortest possible time in which the project can be completed.
Analysis of the Example:
- The Sequence: Finalize Requirements (3) + Design UI/UX (4) + Build App (10) + Test Application (6) + Fix Issues (3) + Deploy (2) = 28 days.
- The Critical Path: In this specific linear example, every single task is on the critical path. If Build App (C) is delayed by one day, the entire project is delayed by one day.
The system visually emphasizes this path (often in orange) to alert the project manager that these specific tasks have zero “float” or “slack.”
Step 5: Exploring What-If Scenarios
The final step in this workflow is dynamic simulation. Traditional static charts require you to manually recalculate dates if a task takes longer than expected. AI-powered tools allow for real-time scenario planning.
Simulating a Bottleneck:
Imagine the development team realizes that the “Build App” phase is more complex than anticipated. The project manager adjusts the duration of Task C (Build App) from 10 days to 7 days (or conversely, adjusts a delay).
The AI instantly recalculates the Total Project Duration. In the diagram, this might show a shift in the timeline, highlighting which tasks are now bottlenecks. For instance, if the “Build App” duration is increased, the Critical Path remains the same, but the Total Project Duration increases accordingly.
Technical Workflow Summary
By following this architecture, organizations can:
- Map Task Sequences: Turn unstructured ideas into a clear order of operations.
- Reveal Dependencies: Understand how tasks connect and rely on one another automatically.
- Estimate Durations: Utilize AI-powered estimates to plan with confidence.
- Spot Bottlenecks: Identify critical tasks that could delay the project.
- Explore What-If Scenarios: Test changes and see the real-time impact on the timeline.